How I built a customer satisfaction platform in 1 week
Summary
7 days
Time to delivery
Elapsed from the first conversation with the agency CEO and director
x3
Expected response rate
Estimate based on WhatsApp vs email benchmarks
€225/month
Subscription cost saved per account
Monthly cost of the comparable market plan: multi-channel surveys with WhatsApp, REST API, webhooks and user roles.
100+
Client accounts manageable from one platform
A comparable market plan starts at €225/month and scales to €1,000-2,000/month on enterprise tiers depending on volume; all of that fragmented subscription cost is absorbed into a single platform controlled by the agency.
Problem
The agency needed a tool to measure their clients' satisfaction and, at the same time, to offer it as a service to those clients. Existing SaaS products did not fully match their needs, and their pricing models made it unviable to build a service around them.
Result
We designed a multi-channel survey platform (WhatsApp, email, SMS, digital kiosk...), with multi-tenant architecture, CRM integrations and automation capabilities, among other features.
My work
The team
- Germán | DevOps
- Juan Ramón | Backend developer (API)
Duration
7 days
Goals
- increase conversion
- reduce churn
- launch a new product line
- validate a market opportunity
- reduce operational costs
- improve retention
- differentiate from competitors
- improve reputation
- sell into a new segment
- automate a manual process
- reduce dependency on sales or support teams
Problem
User or business pain
Current SaaS tools do not work for us because their features do not match what we need. And the price and packaging of their plans make it unviable for us to build a service around them.
Constraints

Deadline?
As soon as possible. We have more priorities than time.
OK. Let's go.
Research
I had no prior experience with this type of product, so I had to research several things. Among others:
- Existing solutions. Competitive benchmarking to understand their products, feature sets, pricing models and target customers.
- Industry terminology. CSAT, NPS, CES — standard concepts that form the foundation of this space and that I needed to understand.
- User opinions about existing solutions. Reading what current or former users said on forums, Trustpilot and similar platforms was useful for understanding what they liked and what they did not.
- Contact with agency clients. To find out whether they understood the value of running surveys, whether they had ever done any, and what their reasons were for doing or not doing them.
- Conversations with the agency CEO and director. Once I had enough context, it was time to align and agree on the project scope.
- Interviews with project managers and the head of sales. To identify the exact points in their existing workflows where triggering a survey would make the most sense.
Findings
- Many local business managers and owners understand the value of these systems, but cost and technical complexity stop them from implementing and actively using them.
- Most existing solutions have so many features that many users feel:
- They are paying for more than they need
- They are hard to use for their actual jobs
- They are too technical in terms of setup, terminology, metrics, interpretation and automation
- They require a marketing agency to manage them, which most of these businesses do not have
Assumptions and validation
I started from four product hypotheses:
- Multi-tenancy from day one The client, the entity and the end user could all be different profiles. If permissions and role hierarchies were not built into the MVP, the product would be much harder to sell to agencies, clinic groups or multi-location businesses.
- Simplicity by default Most users did not want to configure surveys from scratch. They needed presets for common use cases, with advanced options hidden or progressively disclosed.
- Non-technical language The product had to avoid concepts like triggers, webhooks or tokens in the main interface. Users needed to understand the system through their daily operations, not through its internal technical logic.
- Automated delivery The value was not just in collecting responses, but in sending the survey at the right moment. If sending always depended on a manual action, the product would lose scalability and recurring usage.
- NPS, CES and CSAT alone are not enough
Limiting the product to those three standard survey types would waste the real opportunity. We were building a system that could handle any question-and-response scenario. Not allowing more use cases in the interface would be a missed opportunity.
Decisions
One of the most important decisions we had to make:
The CEO proposed integrating the entire system into the agency's internal software, which already served as their CRM, ERP, HR tool and more. However, the discoveries we had made gave us strong arguments for building it as a standalone product.
I shared those arguments with the agency's stakeholders before development started.
- In the medium and long term, they wanted to sell it as a SaaS product even to companies that were not agency clients. Starting with an integrated approach would have created significant technical debt from day one.
- The information architecture of their internal platform imposed visual, navigation and usability constraints on whatever we built inside it.
- Both products were going to evolve independently. Changes or new features in one could force suboptimal decisions in the other.
- Since multi-tenancy did not exist in their internal platform, the technical solutions for adding it there would have been neither clean nor cheap.
There were more reasons than these. The full argument was longer. But a decision was eventually reached.
The main reasons for wanting to keep it integrated were:
- The agency team would not need to switch between two tools with two separate accounts.
- Client-level analytics could still be accessed from within the existing platform.
- Survey triggers could be automated without manual intervention.
The answer to all three was the same:
- REST API and webhooks
Solution
Because speed was the priority, I relied only on these two frameworks:
- User Journey Map (to understand the process and friction points)
- Jobs To Be Done (to shape solution directions)
There were several perspectives to cover, but I focused on the 3 most fundamental ones, which encompass the rest:
- The person creating surveys
- The person responding to surveys
- The person reviewing and interpreting results
From those conclusions, I identified the most specific set of required features.
Information architecture
The most significant architectural challenge was designing the multi-tenant model, where different types of potential clients and users had to coexist, each with their own roles and permissions.
The account and user structure that best fit the requirements looked like this:
Organization A
- Entity A1
- Entity A2
- Entity A3
- ...
Organization B
- Entity B1
- Entity B2
- ...
That way, a single Organization can cover a variety of use cases:
- A marketing agency that needs to run its own surveys and those of its clients.
- A company with multiple locations that needs both segmented and aggregated reporting.
- A company with only one location today but that may grow and need data separation later.
Two levels of access were supported:
- Access to all entities within an organization
- Access to one or several entities within an organization
Within those, individual roles and permissions made it possible to restrict access at nearly the feature level.
Prototype
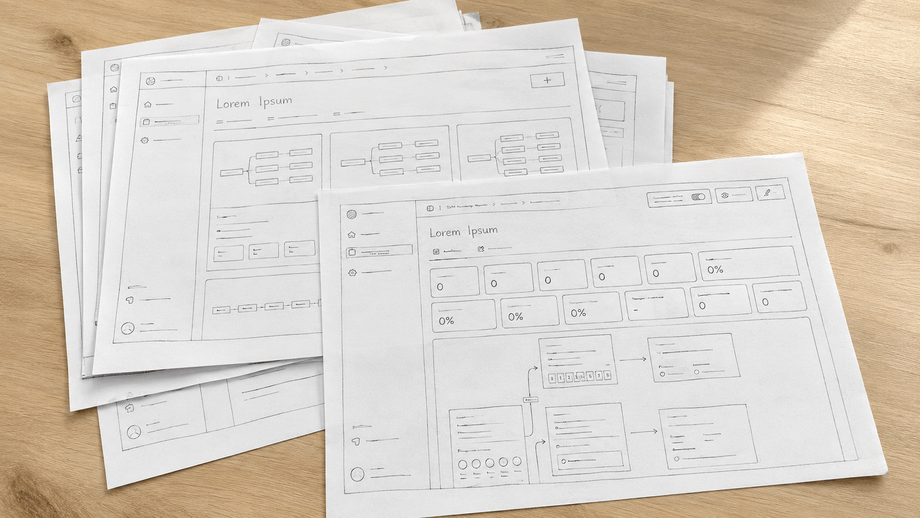
The first version was sketched on paper. Those iterations focused mainly on the survey creation experience and on how results would be consumed in the dashboard.
Statistics were without doubt the area with the most friction. We iterated with the team several times to find the clearest way to make survey results understandable for almost anyone.
Edge cases: errors, empty states, permissions, loading and failures
Some edge cases we needed to address from the start were:
- What should happen if survey delivery fails?
We implemented a retry and fallback system that lets each organization and/or entity configure which delivery channels to use, in priority order. If WhatsApp is priority0and it fails, the system retries a few minutes later. If it fails again, it falls back to priority1. And so on until delivery succeeds. - What should happen when a survey invitation expires?
We observed that the time between the triggering event and the survey itself had to stay as short as possible, since both motivation to respond and the objectivity of answers decay quickly with each passing hour. For that reason, surveys expire after 24 hours, and users are informed if they open the link after that period. - What should happen if a survey is left partially answered, without being submitted?
- The person can still complete it by reopening the link within the 24-hour window.
- It is stored under the metric category "Pending completion".
- After 24 hours, if the user opens the link, they receive a survey-closed message.
- It is saved as a "Partial response" and contributes to the "Abandonment" metric as an indicator for improving surveys.
- The person can still complete it by reopening the link within the 24-hour window.
Delivery
Once the first version of the tool was complete and tested, I needed the collaboration of Germán and Juan Ramón (DevOps and Backend) to:
- Implement a REST API and webhooks in the agency's internal platform, so we could connect this product to it and enable automatic survey triggers.
- Set up the infrastructure for the production deployment.
Impact
7 days
Time to delivery
Elapsed from the first conversation with the agency CEO and director
x3
Expected response rate
Estimate based on WhatsApp vs email benchmarks
€225/month
Subscription cost saved per account
Monthly cost of the comparable market plan: multi-channel surveys with WhatsApp, REST API, webhooks and user roles.
100+
Client accounts manageable from one platform
A comparable market plan starts at €225/month and scales to €1,000-2,000/month on enterprise tiers depending on volume; all of that fragmented subscription cost is absorbed into a single platform controlled by the agency.
Learnings
Most of the product's value did not come from making it easy to create surveys, but from presenting the statistics in a way that non-technical users could understand.
By renaming metrics, adding tooltips and using AI to provide context, we were able to significantly improve how well users understood the survey results.